
Monitoring data flows for Apache NiFi has evolved quite a bit since its inception. What started generally with logs and processors sprinkled throughout the pipeline grew to Prometheus REST APIs and a variety of Reporting Tasks.
These components pushed NiFi closer to clean separation of responsibilities between data processing and the resulting telemetry. However, there have always been trade-offs that required extra work or compromises to running NiFi securely.
Datavolo fills those gaps with the next generation of observability for Apache NiFi pipelines. Our simple, secure, and broadly compatible solution enables 10X Data Engineers to focus on their data, rather than the supporting infrastructure.
What exactly does that mean? Metrics! These flow metrics can tell us if we should scale up our cluster to increase throughput or scale down to save on cost. We can understand our data flows with dashboards, and set up automated notifications instead of staring at charts all day. Want to get an alert if a data record has been stuck in a queue for too long? Or measure the slowest processors over time? With more than 80 unique metrics at your disposal, the possibilities are endless. Let’s take a look at how we got here.
A Brief Review of NiFi Observability
Logs
With in-app System Bulletins, Application Logs, User Audit Logs, and Bootstrap Logs, Apache NiFi provides a lot of features for understanding what is happening at a granular level throughout the architecture. You can enable, disable, and tune levels of logging through logback configurations for nearly every component, down to the class.
While these logs are exceptionally useful for troubleshooting, they often require elevated access to view and a deep understanding of the platform to determine where a particular fix should be applied.
With some exceptions that we’ll cover later, logs provide little insight into the performance of your end-to-end data pipeline or processing anomalies along the way.
Processors
NiFi provides several processors out-of-the-box that can tap into your flow for a variety of observability use cases. These processors include:
Each serves a specific purpose, either for flow activity or for data inspection, but their utility is limited to a particular part of your pipeline. When that grows beyond a few processors into dozens or hundreds, continuing to use processors for general observability becomes quickly impractical both for flow readability and system efficiency.
Reporting Tasks
Reporting Tasks solve many of the limitations of those monitoring processors. They act as background tasks that report metrics across your entire data pipeline or NiFi instance. Some Reporting Tasks cover not only flow metrics, but also system performance indicators like memory usage, active threads, and garbage collections.
There are 3 general categories of reporting tasks that NiFi provides out-of-the-box:
- Loggers
- Prometheus
- External System Integrations
Loggers report system or flow metrics via logs that can also be system bulletins. These provide useful snapshots of information in a human-readable format, but they do not help to understand trends and cannot easily integrate with monitoring systems.
The Prometheus Reporting Task provides an endpoint, hosted at a separate port in the NiFi instance, for standard Prometheus scrapers to inspect at their configured intervals. While this provides a clean decoupling of the data pipeline from the observability platform, it does require that some external task is able to reach into the NiFi system, adding complexity to network and firewall security.
Finally, several reporting tasks send flow and system metrics to external systems like Azure Log Analytics, Datadog, and Ganglia. These components extend the design of decoupling the data pipeline from its observability. They also alleviate the security concerns of hosting an endpoint in NiFi, like Prometheus. However, they are tailored to only those 3 vendors and their specific formats. If you’re using another observability platform, you wind up having to build your own custom extension instead of leveraging tried-and-true components.
REST APIs
Similar to the Prometheus Reporting Task, NiFi provides several native endpoints through its REST API that provide nearly all of the data flow and system metrics available through the UI:
- /nifi-api/flow/metrics/prometheus
- /nifi-api/flow/metrics/json
- /nifi-api/flow/process-groups/root/status?recursive=true
These endpoints allow systems to scrape data with fixed formats, including the Prometheus standard, but they suffer from the same concern of API security. If an external system authenticates with read-only access to collect metrics, why should it have read access to anything else?
The Solution: Datavolo’s OpenTelemetry Reporting Task
Why another reporting task? They solve many observability needs, but previous implementations required security trade-offs, complex networking setups, and/or too narrowly focused on a particular observability vendor.
With those lessons in mind, Datavolo took a different approach that combines today’s best practices with a clean user experience.
Simple
Datavolo’s Reporting Tasks enable data engineers to tune telemetry to their needs. Metrics are available inside all Runtimes from the start, but you don’t have to make any decisions up-front about how or whether you’ll monitor your flow externally. You can get data flowing quickly, and easily integrate with external monitoring at any point.
In particular, Datavolo’s OpenTelemetry Reporting Task can run as-is for on-prem deployments with local OTel collectors. If you’re using a managed Runtime in Datavolo Cloud, connecting to a remote OTel collector requires as little as 3 properties.
Need to send metrics to more than one collector? Experimenting with a new platform, or fully migrating? With a few clicks in the Datavolo Runtime, you can have as many OTel reporting tasks running as you need, each sending to a different endpoint and at different frequencies.
Secure
The OpenTelemetry Reporting Task is egress-only: it sends data to the OTLP-compatible endpoint of your choosing.
Unlike other reporting tasks, you don’t need to open up ports or punch holes in your authentication and authorization layers just to get your flow metrics. There are no bespoke rules to configure; security is built-in to the architecture.
Compatible
More than 60 commercial vendors natively support OTLP, so you no longer need to build your own observability tools. Beyond protocol compatibility, Datavolo’s OpenTelemetry Reporting Task allows for a variety of authentication mechanisms, from Basic Auth to Bearer Tokens and Client Certificates.
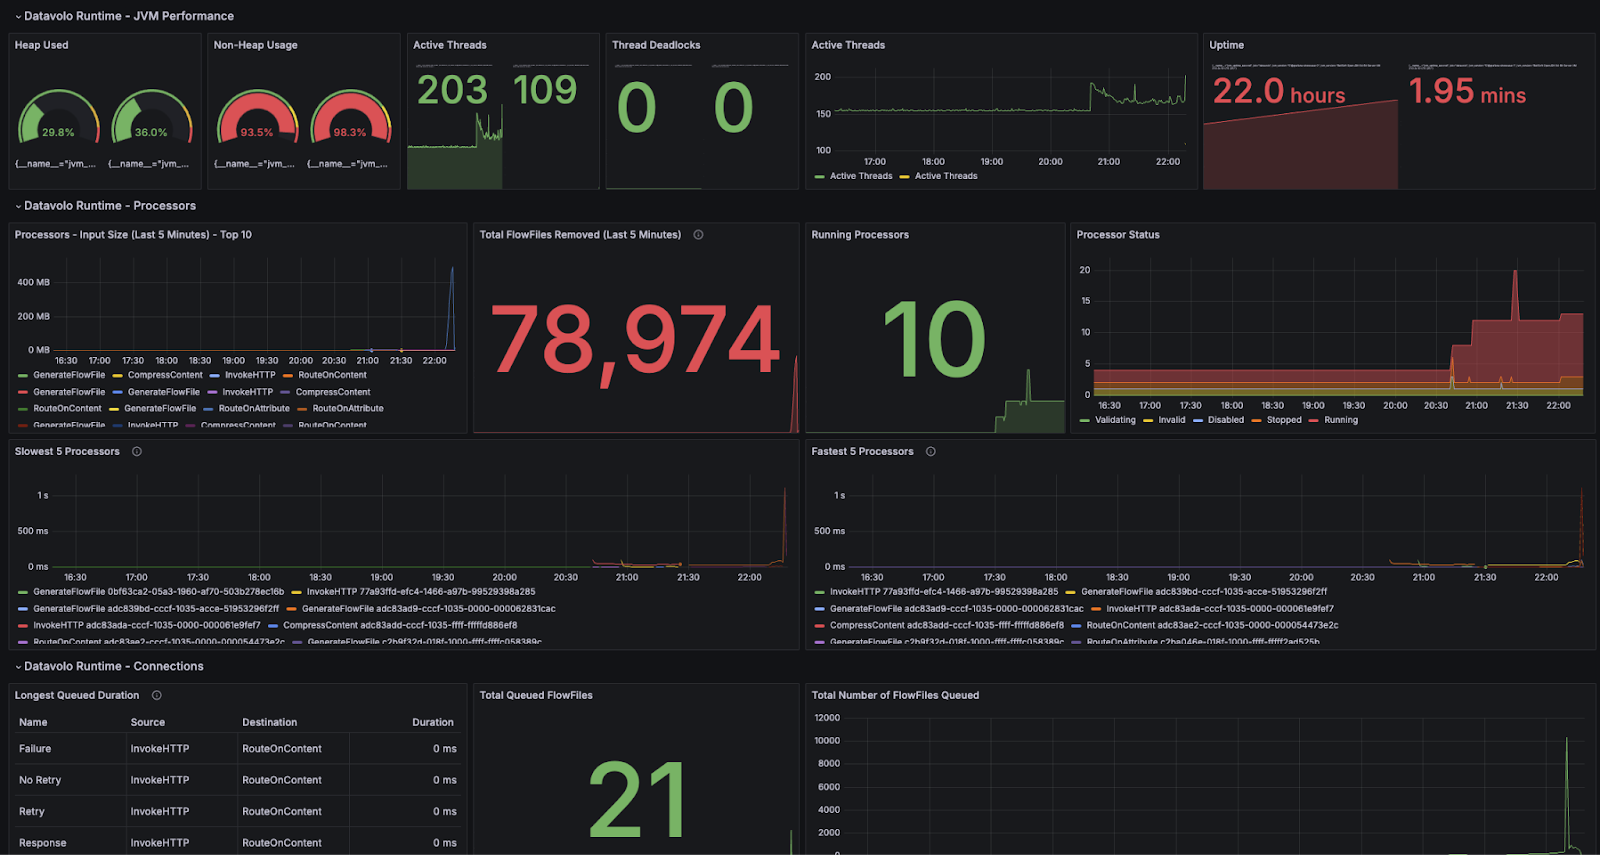
We’ve made it easy to use your existing telemetry platform, or get started quickly with many great options. For starters, our Monitoring with Grafana integration guide walks you through a few simple steps to have a full dashboard and alerting system in place within minutes!
Production Readiness with Datavolo
Datavolo makes it easy for data engineers to develop pipelines quickly. Securely integrating with a wide variety of observability platforms also reduces the effort of getting work into production where it has the biggest impact. Whether running on-prem with Datavolo Server or a managed Datavolo Cloud instance, Datavolo Runtimes have the tools you need to build and deploy with confidence.