Finding the Observability Balance
Through our evaluation of observability options at Datavolo, we’ve seen a lot of strong vendors providing real-time dashboards, ML-driven alerting, and every feature our engineers would use to evaluate our services across the three pillars of observability: logs, traces, and metrics. Of course, all of these rely on getting that observability data to the vendors in the first place! Sounds similar to how Datavolo is engineered to support AI with multimodal data pipelines, right? That’s why we’re dogfooding our own cloud native Datavolo runtime, powered by Apache NiFi, for our observability pipeline. You might consider the same!
How did we get there? We wanted a solution that supports our engineers and keeps costs low for our customers. It also needed to be flexible for an early stage startup while providing enterprise-grade reliability and scalability. Instrumenting our services with the open-source OpenTelemetry (OTel) observability framework became a natural choice that avoids vendor lock-in and enables all of the features that we would need. More than 40 vendors natively support OpenTelemetry Protocol (OTLP), and it has become a de facto standard across vendors.

Source: https://opentelemetry.io/docs/
Next, we needed to get this data from our services to an OTLP vendor. Many vendors, including the OpenTelemetry initiative itself, provide SDKs and low-overhead runtime agents that send data directly to SaaS offerings. Alternatively, we could configure OpenTelemetry Collectors either with YAML or the emerging Open Agent Management Protocol (OpAMP) Control Plane.
Managing large configuration files across a distributed system would introduce quite a bit of complexity, especially when Datavolo already has a platform that provides:
- Out-of-the-box support for OTLP
- Guaranteed delivery and dynamic prioritization
- Runtime modification of receivers, filters, transforms, and connectors
Native OTLP Support
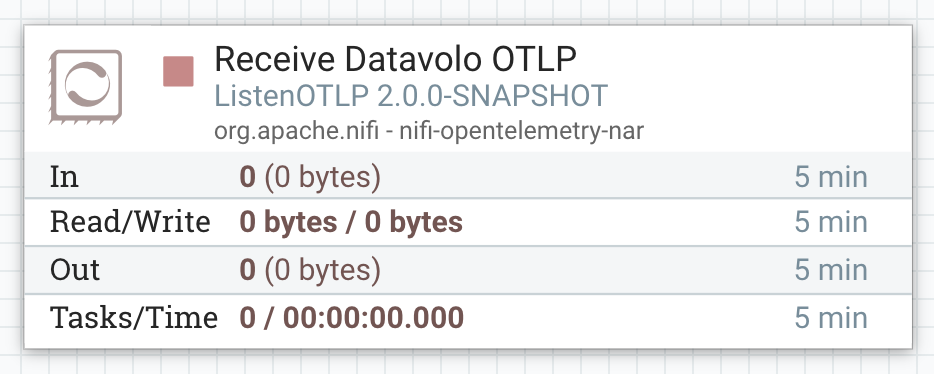
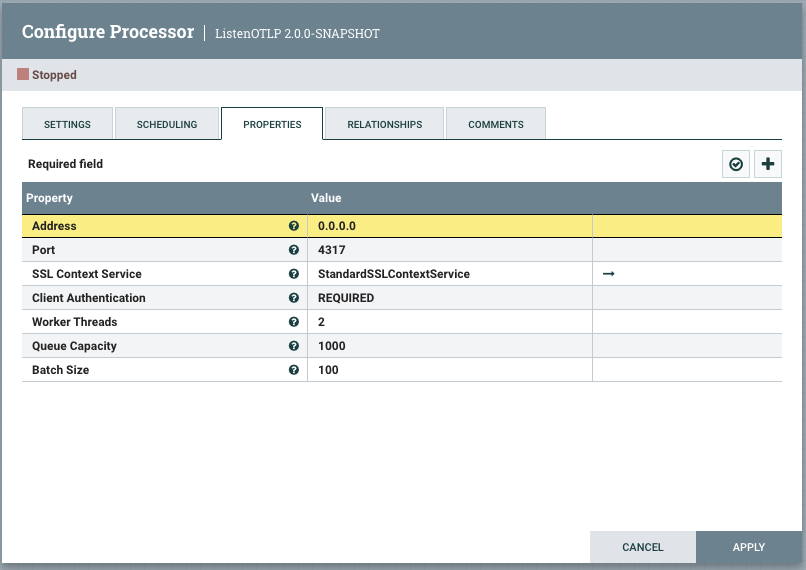
Datavolo supports OTLP out-of-the-box with NiFi’s ListenOTLP processor. Security, scalability, and reliability are baked into the core, allowing us to focus on meeting the needs of our observability pipeline. Dropping a processor onto the canvas is all we need to provide an SSL-enabled endpoint for all of our OTLP-instrumented services.


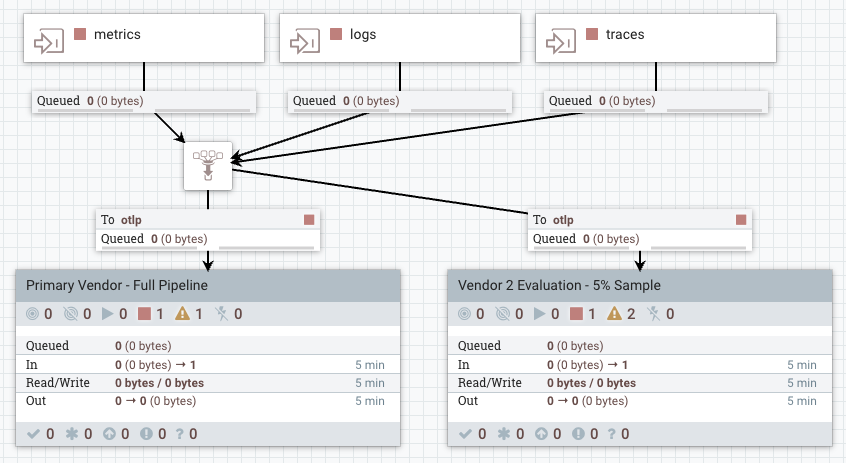
On the other end, sending our observability data to one or more OTLP-compatible vendors is a breeze with our data routing and HTTP connectors. Whether we’re evaluating a new vendor with a subset of our production pipeline or doing a full bake-off, we can quickly strike the right balance through the drag-and-drop interface.

Prioritizing Observability Data
As much as we’d like to capture every user request, performance metric, debug log, and distributed trace to our teams for analysis, we need to be conscious of the costs of continuously sending all of that data to our APM vendor(s):
- Lower ROI with increasing operational $$
- Noise drowning out signals
- Higher compute, memory, and network needs
As our business needs evolve, we’ll use the wide variety of Datavolo’s processors to send high priority signals to our vendors. Then, we can either archive lower priority data into low cost, long term storage, or drop it entirely.
How is that defined? We may have some of those answers right now, but we expect it will evolve over time. Datavolo shines here because we can change our data pipelines as our needs change without compromising end-to-end integrity.
With our flexible and configuration-driven data pipeline, we don’t have to take an “all or nothing” approach. We can sample the signals just as easily to help reduce the cost when it may not be needed.
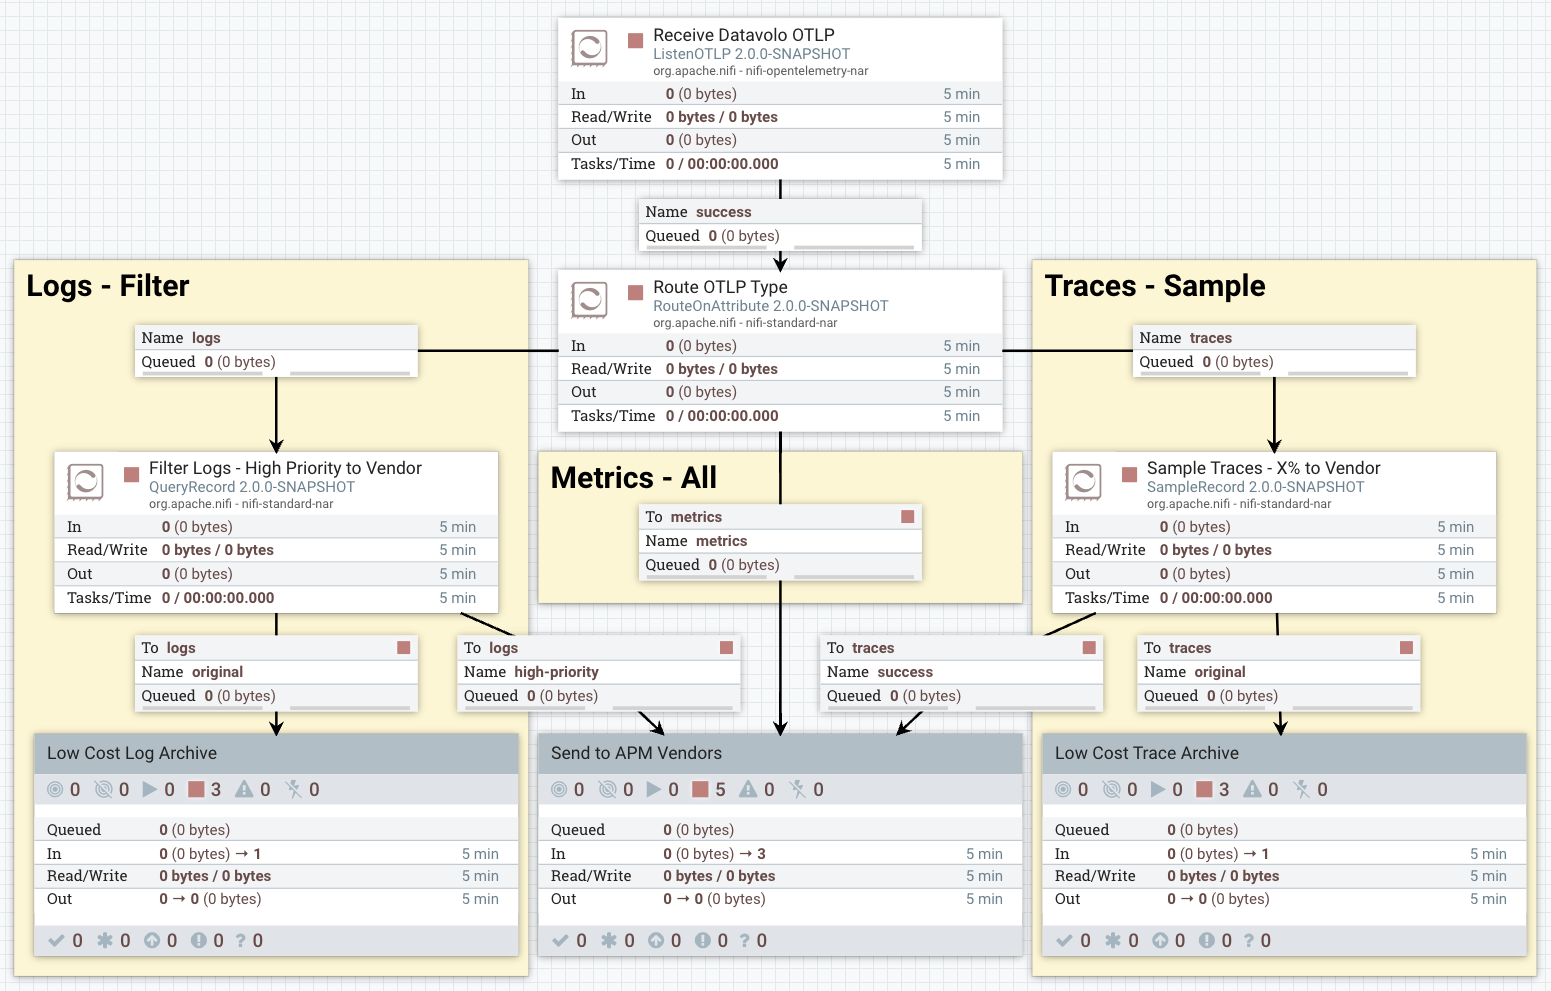
The flow illustrates one of the many ways that we can balance our observability needs and costs:
- Only certain logs are sent to the vendor, identified as high priority based on our needs. Any field in our logs and OTLP metadata can be used as filter criteria.
- All metrics are sent to the vendor. Consistent and low volume measurements in time windows give us predictable spend as we develop new features.
- Some percentage of traces are sent to the vendor, enabling engineering visibility without overload

Operational Support
Observability needs change. Ideally, that change is planned and executed with the natural evolution of distributed systems over weeks, months, and years. As Google’s SRE book tells us from the start, “Hope is not a strategy.” When systems break, incident response calls for rapid, controlled actions that can identify the affected resources and deploy mitigations. Reliability issues for critical services quickly become business issues, either through lost revenue or lost customer trust.
The financial cost of downtime varies by industry and the size of your business, of course. Several surveys gathered by Atlassian estimated the loss from outages ranges from hundreds to thousands of dollars per minute.
In our observability scenario, we only sent a small percentage of traces to the observability vendor to balance our cost and risks. Let’s consider our options if we find that logs and metrics aren’t enough to diagnose an issue with some production service. If we’re lucky, we sampled the trace and can fully diagnose the issue.
Since we don’t rely on luck, we’ll need a way to respond if the trace was not sampled. Here, Datavolo shines again with its support for runtime configuration changes of data pipelines. We can change the sample rate of traces to send everything within a matter of seconds. There’s no need to waste precious time waiting for rolling restarts to pick up a configuration change while customers are feeling pain.
Then, we can investigate the trace, mitigate the issue, and revert the sampling change as easily as we made it.
Conclusion
Datavolo’s NiFi runtime unlocks the potential of multimodal data for generative AI for our customers. Internally, it provides just as much power and flexibility to observability data! With native support for OpenTelemetry and a robust set of features for managing operational pipelines, using Datavolo is a natural choice for OTLP collection and distribution.
Your business needs may vary, but Datavolo’s technical expertise can provide secure, reliable, and cost-effective solutions for your mission critical data.
